Analyzing your Cluster
Analyze the state of a cluster where AIBooster PO has been deployed.
Cluster Overview
The Cluster Overview dashboard provides a comprehensive view of the overall cluster status. By checking this dashboard regularly, you can identify potential anomalies or inefficient jobs running in the cluster.
Use the time range selector in the upper right to set the observation period you want to review.
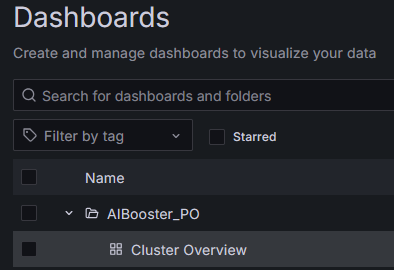
The Cluster Overview dashboard can be opened by selecting Cluster Overview under the AIBooster_PO directory in the dashboard list.
Cluster Overview: Job
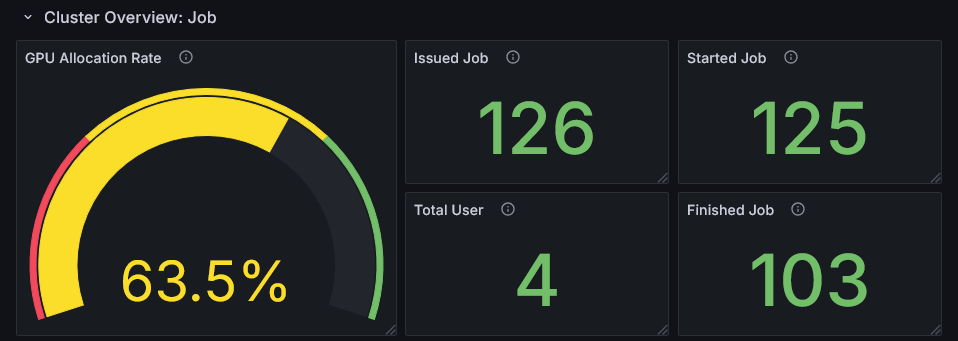
This row shows statistical information about job activity in the cluster.
This row consists of panels that assume a job management system is deployed in the cluster.
Clusters without a job management system cannot retrieve accurate values.
In unsupported environments, the GPU Allocation Rate (left side of the screen) will show Unavailable.
Also, in such unsupported environments, the metrics on the right side of the screen may display inaccurate values.
If you do not need this row, you can collapse it by clicking the header.
![]()
GPU Allocation Rate
This metric represents the proportion of time during the observation period that all jobs had GPUs allocated. A low value indicates that cluster users are not making much use of GPUs. It is recommended to encourage more active GPU utilization or consider adding new workloads. Conversely, if the value is close to 100%, it is difficult to add new jobs, so consider improving the performance of individual jobs. Check the GPU hardware metrics in the next row.
Issued Job, Started Job, Finished Job
These are statistical metrics about job execution status during the observation period.
Issued Job represents the number of jobs submitted by users during the period.
Started Job represents the number of jobs counted as Issued Job that began execution during the period.
If Started Job is significantly lower than Issued Job, jobs may be queued and users' work may be stalled.
Finished Job represents the number of jobs counted as Issued Job that started and completed execution during the period.
If Finished Job is significantly lower than Issued Job, the following may be the cause:
- Jobs running in the cluster tend to run over a longer timespan than the observation period
- A large number of jobs were submitted just before the end of the observation period
Cluster Overview: Averaged Metrics
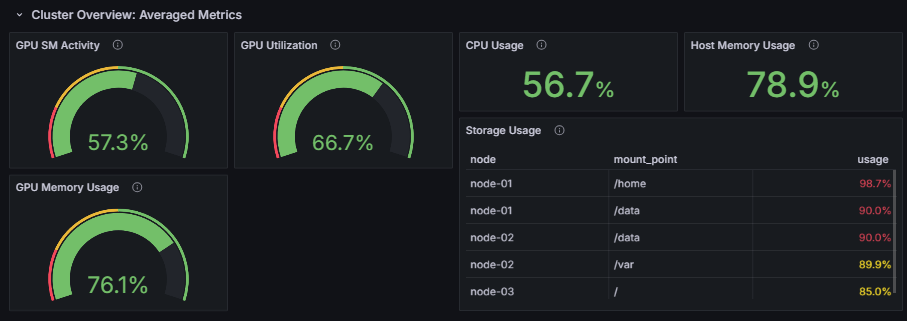
This row displays hardware metrics for the entire cluster.
GPU SM Activity, GPU Utilization, GPU Memory Usage
These metrics display the average values across all GPUs in the cluster. The meaning of each metric is as follows:
GPU SM Activity- The actual computational efficiency of GPU cores
- A high value indicates that GPU processing in the cluster is running with high efficiency
GPU Utilization- The proportion of time the GPU is being used
- A value of 100% indicates that some GPU processing is always running in the cluster
GPU Memory Usage- The proportion of GPU memory being used
- Especially for AI workloads, utilizing more GPU memory tends to result in more efficient operation
GPU Utilization is a metric that indicates "the proportion of time that any kernel was running on the GPU."
It reaches 100% even if only one kernel is running, so it does not tell you how much of the GPU's computational resources are actually being used.
On the other hand, GPU SM Activity indicates "the proportion of time that the GPU's Streaming Multiprocessors (SMs) were actually performing computation."
It more accurately reflects how much of the GPU's computational resources are being utilized.
Performance improvement approaches need to be considered on a per-job basis, but the following general strategies can be considered:
- ❌ Both Utilization and SM Activity are low
- Check whether the job is actually using the GPU
- ⚠️ Utilization is high, but SM Activity is low
- Modify the GPU processing to run more efficiently
- ✅ Both Utilization and SM Activity are high
- GPU processing is running efficiently, so consider a different approach
CPU Usage, Host Memory Usage
CPU Usage represents the average usage rate of all CPU cores in the cluster.
Host Memory Usage represents the average memory usage rate across all nodes.
If these values are higher than usual despite no CPU- or memory-intensive jobs running,
there may be some anomaly occurring on the cluster.
Storage Usage
Storage Usage allows you to check which storage volumes on the cluster have high utilization.
Select the mount points to monitor from the "Mount Points" selector at the top of the dashboard.
Choose mount points you want to monitor for cluster operations, such as /home or /mnt (multiple selections allowed).
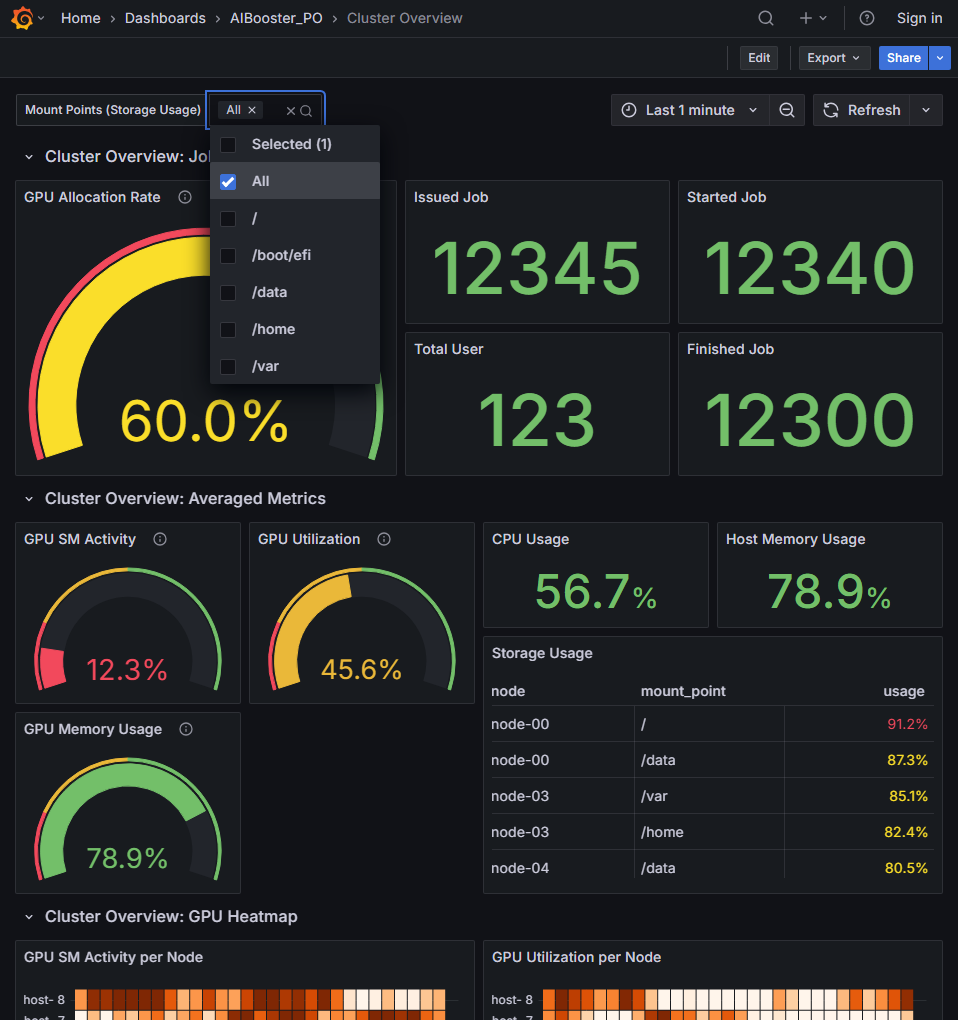
Up to 5 storage volumes (mount points) using 80% or more of their capacity are displayed. By taking appropriate action before storage is exhausted, you can keep operations running without interrupting users.
- If shared storage is monitored, the same information will be displayed across multiple nodes
- The mount point paths to monitor are common across all nodes
- If the observation period is in the past, the storage status is evaluated based on the state at the end of the observation period
Cluster Overview: GPU Heatmap
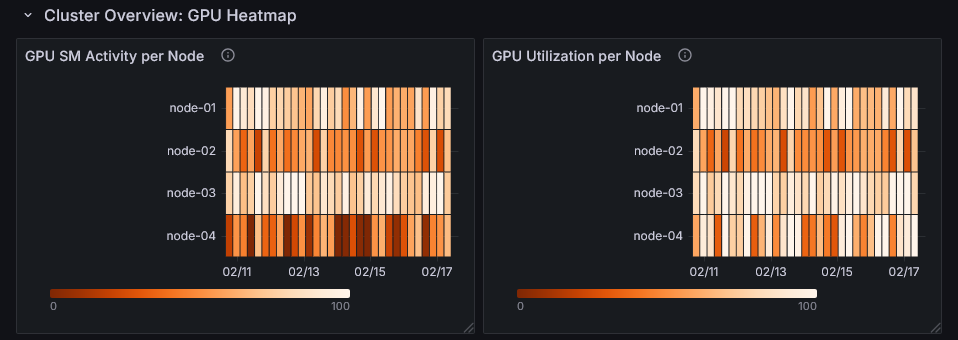
This row displays GPU utilization (GPU SM Activity and GPU Utilization) per node as a heatmap.
You can identify which nodes and time periods have high GPU utilization.
By examining the heatmap alongside the activity of specific nodes and jobs running during the same time period, you can develop strategies for performance improvement.
Active Node List
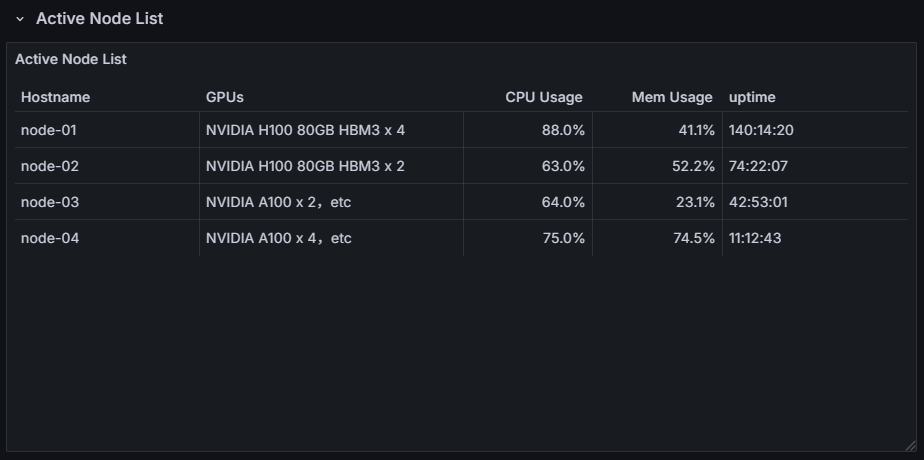
You can view a list of nodes that were active during the observation period. It also shows the CPU usage, memory usage, and uptime (uptime at the end of the observation period) for each node. This allows you to check whether any unintended conditions are occurring on a per-node basis.