Customize Visualization and Telemetry
AIBooster PO (hereafter referred to as PO) is built on top of OSS such as OpenTelemetry and Grafana, and can be flexibly customized from telemetry data collection to dashboard visualization. This page describes how to customize PO.
Creating Grafana Dashboards
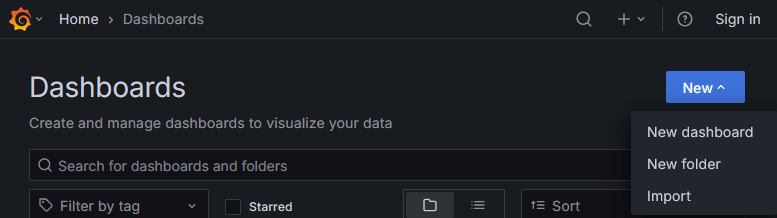
You can also build your own dashboards on Grafana. To add a custom dashboard, click "New" in the upper right corner of the dashboard list, then select "New dashboard".
The content of dashboards provided by PO (PO standard dashboards) may change in future updates. If you directly edit a PO standard dashboard, future updates may not be reflected. If you want to add custom panels to a PO standard dashboard, please copy the dashboard first and edit the copy rather than editing the PO standard dashboard directly.
PO Panel Library
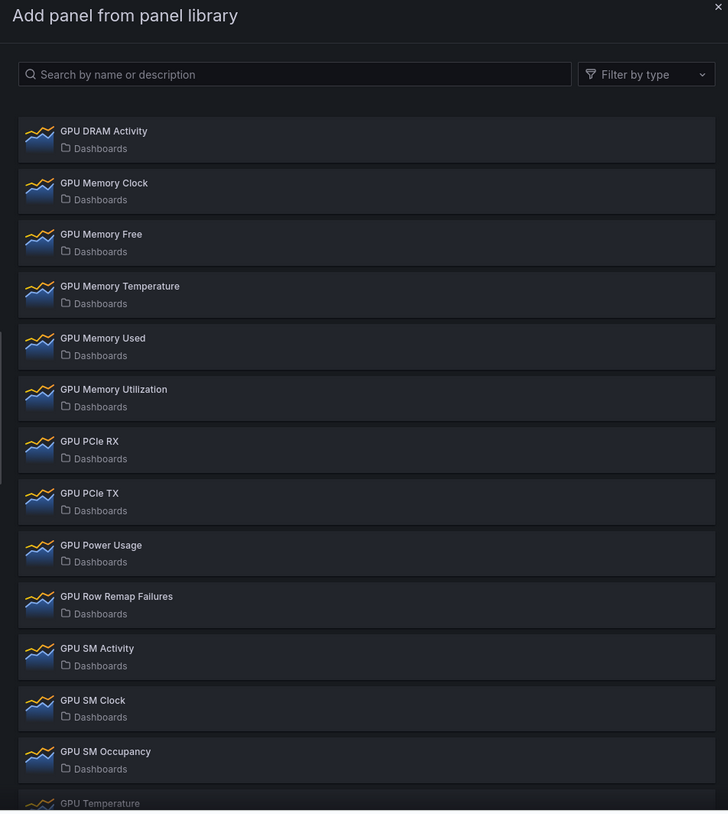
PO standard dashboards display only representative metrics. If you want to view other detailed metrics, you can easily add them using the Panel Library with the following steps:
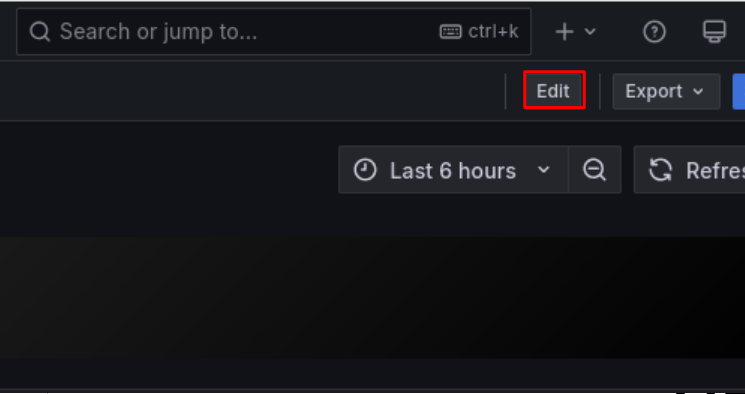
- Switch to "Edit" mode on the dashboard
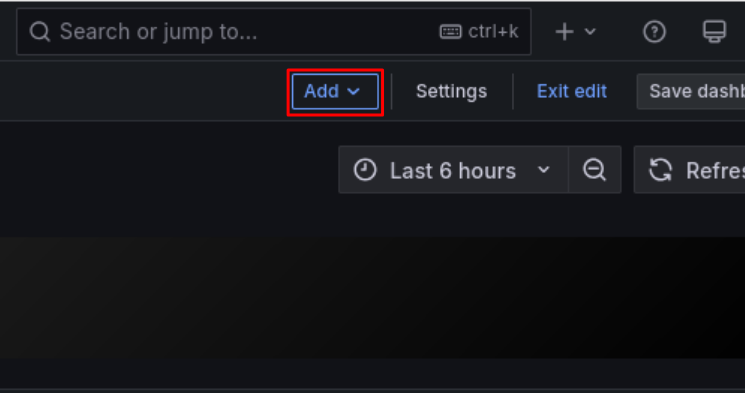
- Click "Add"
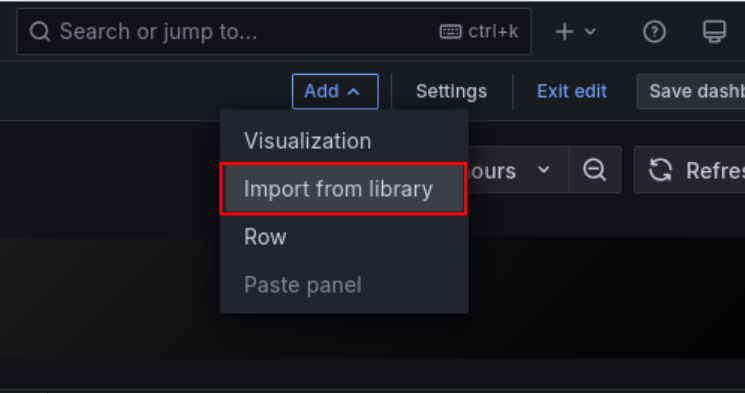
- Click "Import from library"
- Click the desired panel from the library panel list
- After adding the panel, click "Save dashboard" in the upper right corner if needed
Available Panels
PO provides the following types of panels:
- GPU-related metrics (DCGM): GPU utilization, temperature, power consumption, memory usage, profiling information, etc.
- System metrics (Node Exporter): CPU load, memory, filesystem, network, etc.
- Process/Application metrics: Process information, scraping statistics, etc.
For a complete list of metrics and detailed descriptions, see Metrics Details.
Adding Custom Telemetry Data
You can also collect your own telemetry data that PO does not collect by default and display it on dashboards. This requires two steps: adding telemetry data and implementing panels.
Step 1: Adding Telemetry Data
PO uses OpenTelemetry for telemetry data collection. You can add traces, metrics, and logs — the signal types supported by OpenTelemetry.
There are two main methods for adding custom telemetry data:
Each method is described below.
To avoid conflicts with PO's default telemetry data collection, please note the following when creating custom telemetry data:
- Ensure that service names do not overlap with existing telemetry data
- It is recommended to prefix service names with
customor an organization-specific prefix - In particular, the following prefixes are reserved and must not be used
aibooster,faib,JobTracer
- It is recommended to prefix service names with
Adding from an application
PO runs an OTLP receiver (gRPC) on port 26697 on each node where the Agent is installed.
Any tool that conforms to the OpenTelemetry Protocol (OTLP) can send telemetry data to localhost:26697.
This allows you to record telemetry data from your own applications alongside the data collected by PO.
The following example shows how to add custom metrics from Python code.
-
Install the OpenTelemetry SDK for Python.
pip install \
  opentelemetry-api \
  opentelemetry-sdk \
opentelemetry-exporter-otlp-proto-grpc -
Create and run the following metrics sending script.
import time
import random

from opentelemetry import metrics
from opentelemetry.sdk.resources import SERVICE_NAME, Resource
from opentelemetry.sdk.metrics import MeterProvider
from opentelemetry.sdk.metrics.export import PeriodicExportingMetricReader
from opentelemetry.exporter.otlp.proto.grpc.metric_exporter import OTLPMetricExporter

MY_SERVICE_NAME = "custom-my-application"

def configure_opentelemetry():
    resource = Resource(attributes={
        # Set service name (see "Notes on adding telemetry data")
        SERVICE_NAME: MY_SERVICE_NAME
    })
    exporter = OTLPMetricExporter(
        endpoint="http://localhost:26697",  # Send to PO's collector
        insecure=True                       # Use HTTP for same-host communication
    )
    # Read and send metrics at regular intervals
    reader = PeriodicExportingMetricReader(
        exporter,
        export_interval_millis=30000 # Set export interval
    )
    provider = MeterProvider(resource=resource, metric_readers=[reader])
    metrics.set_meter_provider(provider)
    print("configure_opentelemetry done", flush=True)


def main():
    configure_opentelemetry()
    # Create the required metrics
    meter = metrics.get_meter(MY_SERVICE_NAME)
    my_metric = meter.create_gauge(
        name="sdk_random",
        description="Random value by Python OpenTelemetry SDK",
        unit="1"
    )
    count = 0
    while True:
        # Set value and attributes for the metric
        # Note: actual export happens at the export interval
        # (every 30 seconds, not every 10 seconds)
        my_metric.set(random.random(), {"device_id": "0"})
        time.sleep(10)
        print(f"sending... {count}", flush=True)
        count += 1


if __name__ == "__main__":
    main()
Wait at least 3 minutes for enough metrics to accumulate before stopping the script. (You can also proceed with Step 2: Implementing custom panels while waiting.)
The hostname where the Agent is running is collected by PO by default, so there is no need to collect it separately. Therefore, no special handling is required when running as a container application (however, port configuration is needed so that the OTLP receiver is accessible from within the container).
Adding a Prometheus-compatible exporter
You can also collect metrics from Prometheus-compatible exporters. You can use existing exporters or create your own.
The following example shows how to create a custom exporter (custom-my-exporter) that reports random values and add it to the configuration file.
-
Install
prometheus_client.pip install prometheus-client -
Create and run the following exporter script. It exposes metrics on port 8000.
import random
import time
from prometheus_client import start_http_server, Gauge

my_gauge = Gauge(
    "exporter_random",
    "A random value for testing",
    ["device_id"],
)

if __name__ == "__main__":
    start_http_server(8000)
    while True:
        my_gauge.labels(device_id="1").set(random.random())
        time.sleep(5)
You can verify that metrics are available by running
curl http://localhost:8000/metrics. -
Add the exporter to the OpenTelemetry Collector configuration file (
/opt/aibooster/agent/static/agent-otel-collector.template.yaml).receivers:
# ...(omitted)
# prometheus/ is fixed; set the custom-my-exporter part to avoid duplication with others
prometheus/custom-my-exporter:
config:
scrape_configs:
# job_name is used as the service name (see "Notes on adding telemetry data")
- job_name: 'custom-my-exporter'
static_configs:
- targets: ['localhost:8000'] # Match the exporter's port setting
scrape_interval: 30s # Set the scrape interval
# ...(omitted)
service:
pipelines:
traces:
receivers: [otlp]
processors: [batch, resourcedetection]
exporters: [clickhouse]
metrics:
receivers:
- prometheus/custom-my-exporter # Add this line
- otlp{{"\n"}}
# - ...(omitted)noteThe template file must be updated on all nodes where the AIBooster PO Agent is installed.
Once configured, restart the AIBooster PO Agent service to apply the settings.
sudo systemctl restart aibooster-agent-endpointWait at least 3 minutes for enough metrics to accumulate. (You can also proceed with Step 2: Implementing custom panels while waiting.)
Step 2: Implementing custom panels
You can build panels with custom telemetry data and aggregation methods in the browser.
Select "Edit" mode -> "Add" -> "Visualization" to open the panel editor.
Here, as an example, we will create a panel that displays the two types of metrics created in Step 1: Adding telemetry data as a time series line chart.
Open the panel editor and configure it as shown in the following image.
The image shows an example of displaying metrics created with the "Adding from an application" method.
To display metrics created with "Adding a Prometheus-compatible exporter",
modify the WHERE clause conditions to ServiceName = 'custom-my-exporter' and MetricName = 'exporter_random' respectively.
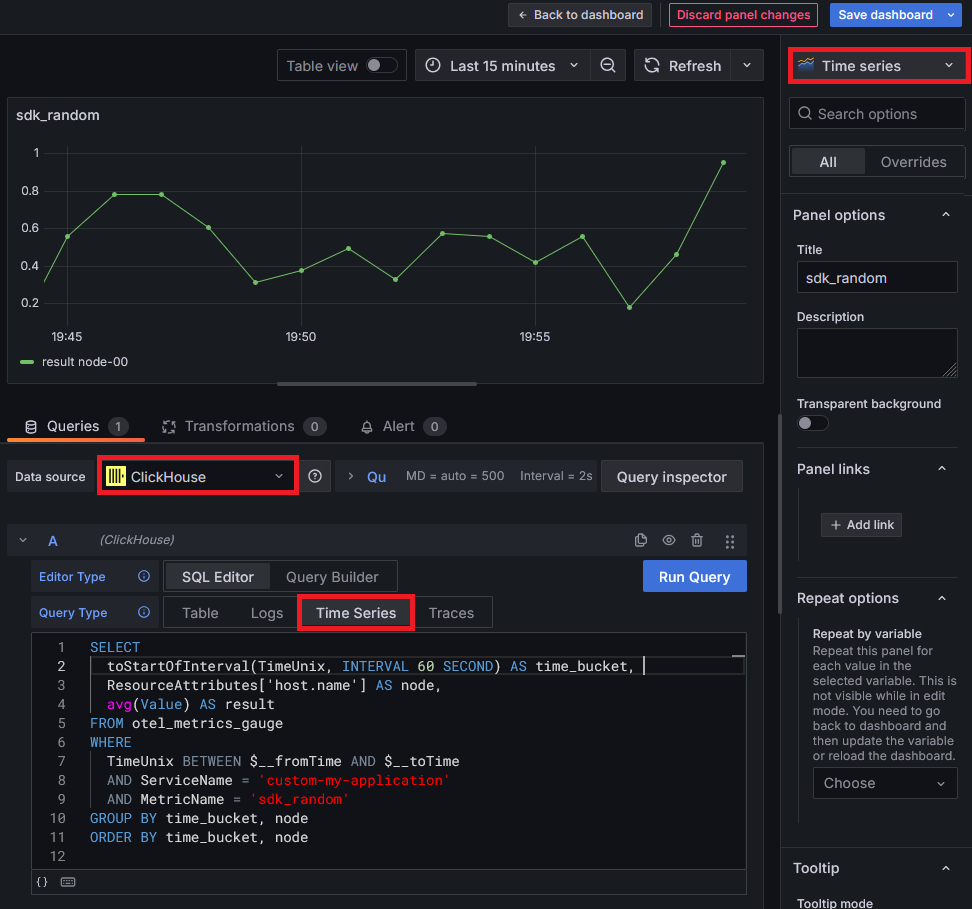
Set the data source to ClickHouse and verify that the panel type (upper right) and Query Type setting (around the center) match the image.
SELECT
  toStartOfInterval(TimeUnix, INTERVAL 60 SECOND) AS time_bucket,
  ResourceAttributes['host.name'] AS node,
  avg(Value) AS result
FROM otel_metrics_gauge
WHERE
  TimeUnix BETWEEN $__fromTime AND $__toTime
  AND ServiceName = 'custom-my-application'
  AND MetricName = 'sdk_random'
GROUP BY time_bucket, node
ORDER BY time_bucket, node
If the graph is not displayed, check the following:
- Verify that the time range setting at the top of the screen is appropriate.
- Turn on Table View at the top of the screen to check the query results in a table. Verify that the query results are not empty.
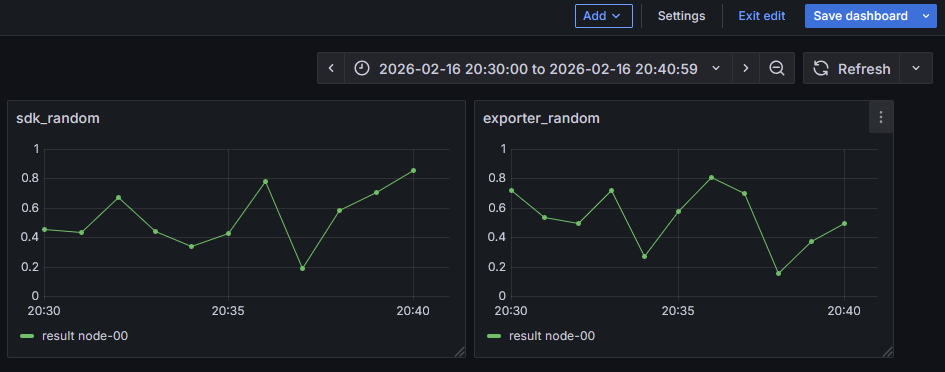
The dashboard with two custom panels added will look like the following. If you want to adjust the panel display, you can also modify the parameters on the right side of the panel editor. Don't forget to click "Save dashboard" in the upper right corner after editing dashboards/panels.
All telemetry data collected by PO is stored in ClickHouse via OpenTelemetry. For details on how OpenTelemetry signals (telemetry data) are handled in ClickHouse, see clickhouseexporter and related documentation.
Please note the following when writing custom SQL:
- When referencing custom telemetry data, always include
ServiceNamein the WHERE clause - PO updates may result in the deprecation or modification of collected telemetry data
- If your custom panels reference PO standard telemetry data, verify that they work correctly after updates
- Please check the release notes for changes. If you have any questions, contact customer support.