Your First Dashboard
Learn how to observe system performance using AIBooster dashboards. This guide explains basic operations and how to read key metrics.
Basic Dashboard Structure
After logging in, you'll see the Grafana home screen.
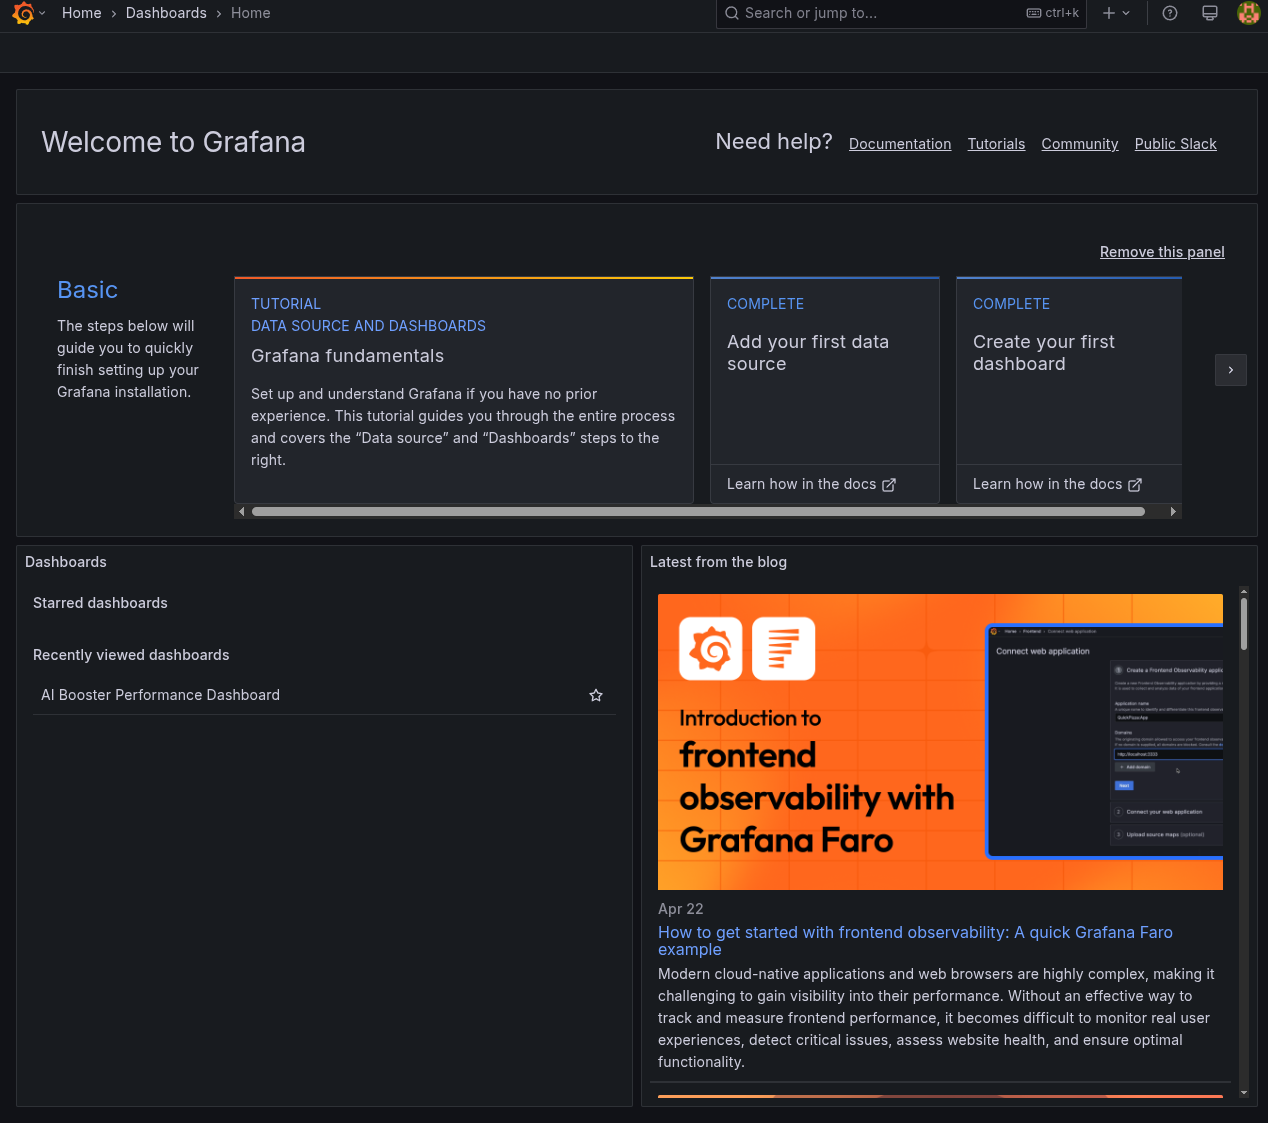
Main Areas
-
Left Sidebar: Navigation menu
- Home: Home screen
- Dashboards: Dashboard list
- Explore: Data analysis with user queries
- Configuration: Settings
-
Main Area: Dashboards and panels
-
Top Toolbar: Time range selection, etc.
Opening Your First Dashboard
- Click "Dashboards" in the left sidebar
- Select "Performance Overview" or "Cost Overview"
Dashboards with "Details" in their names are designed to be accessed from Overview dashboards. Always start with these two dashboards:
- For performance analysis: Performance Overview
- For cost analysis: Cost Overview
Understanding Key Metrics
1. GPU Utilization
- Meaning: How much the GPU is being used
- Ideal value: 80-95% during training
- Note: Below 50% indicates bottlenecks outside of GPU
2. GPU SM Activity
- Meaning: Actual computational efficiency of GPU cores
- Ideal value: 70% or higher
- Note: If Utilization is high but SM Activity is low, GPU cores are not being used efficiently
3. CPU Utilization
- Meaning: CPU usage status
- Ideal value: Balanced usage across cores
- Note: If specific cores are stuck at 100%, CPU may be a bottleneck
4. Memory, Interconnect, Storage Bandwidth
- Meaning: Effective bandwidth of various I/O
- Ideal value: Cannot be judged by this metric alone - evaluate in conjunction with other metrics
Basic Operations
Changing Time Range
Change the observation period with the time range selector in the top right:
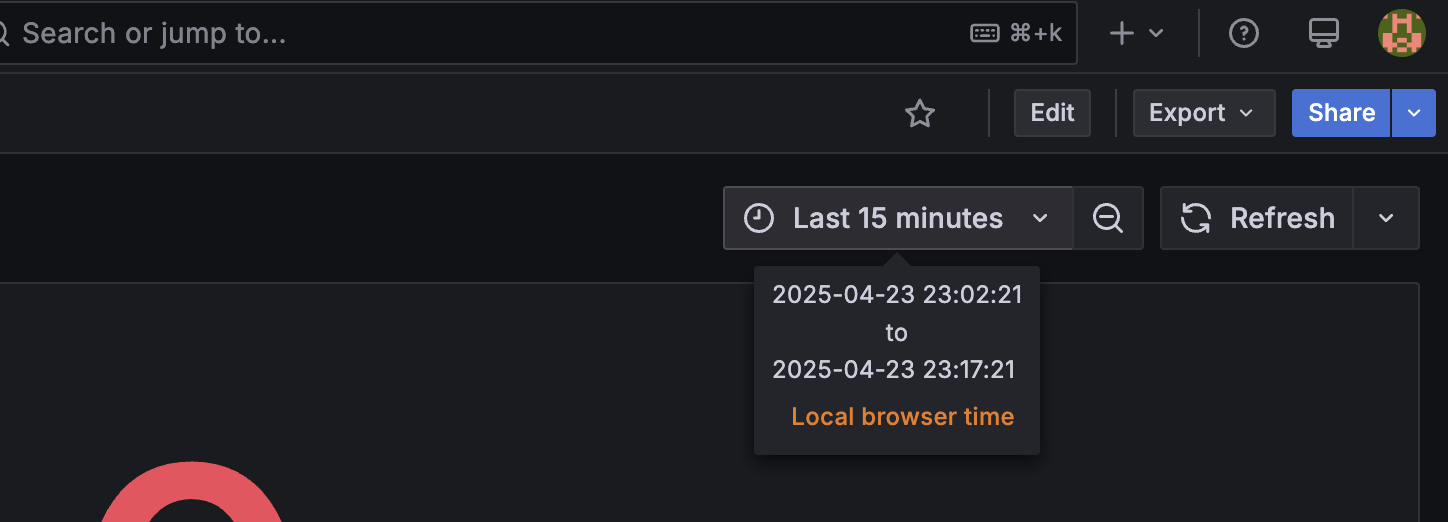
- Last 5 minutes: Last 5 minutes
- Last 1 hour: Last hour
- Last 24 hours: Last 24 hours
- Custom range: Custom period
Zooming and Detailed View
- Drag to zoom: Drag on graph to zoom to specific period
- Maximize panel: Click View button from 3-dot icon in panel top right
- Check data: Hover cursor over graph to show detailed values
💡 Common Questions and Answers
Q: Metrics aren't showing
A: Check the following:
- Is the setup completed correctly (no errors)?
- Is the time range appropriate (not looking at a period with no data)?
- See Troubleshooting
Q: I don't understand what the graphs mean
A: Hover over the "i" icon on each panel to see an explanation.