Analyze Performance
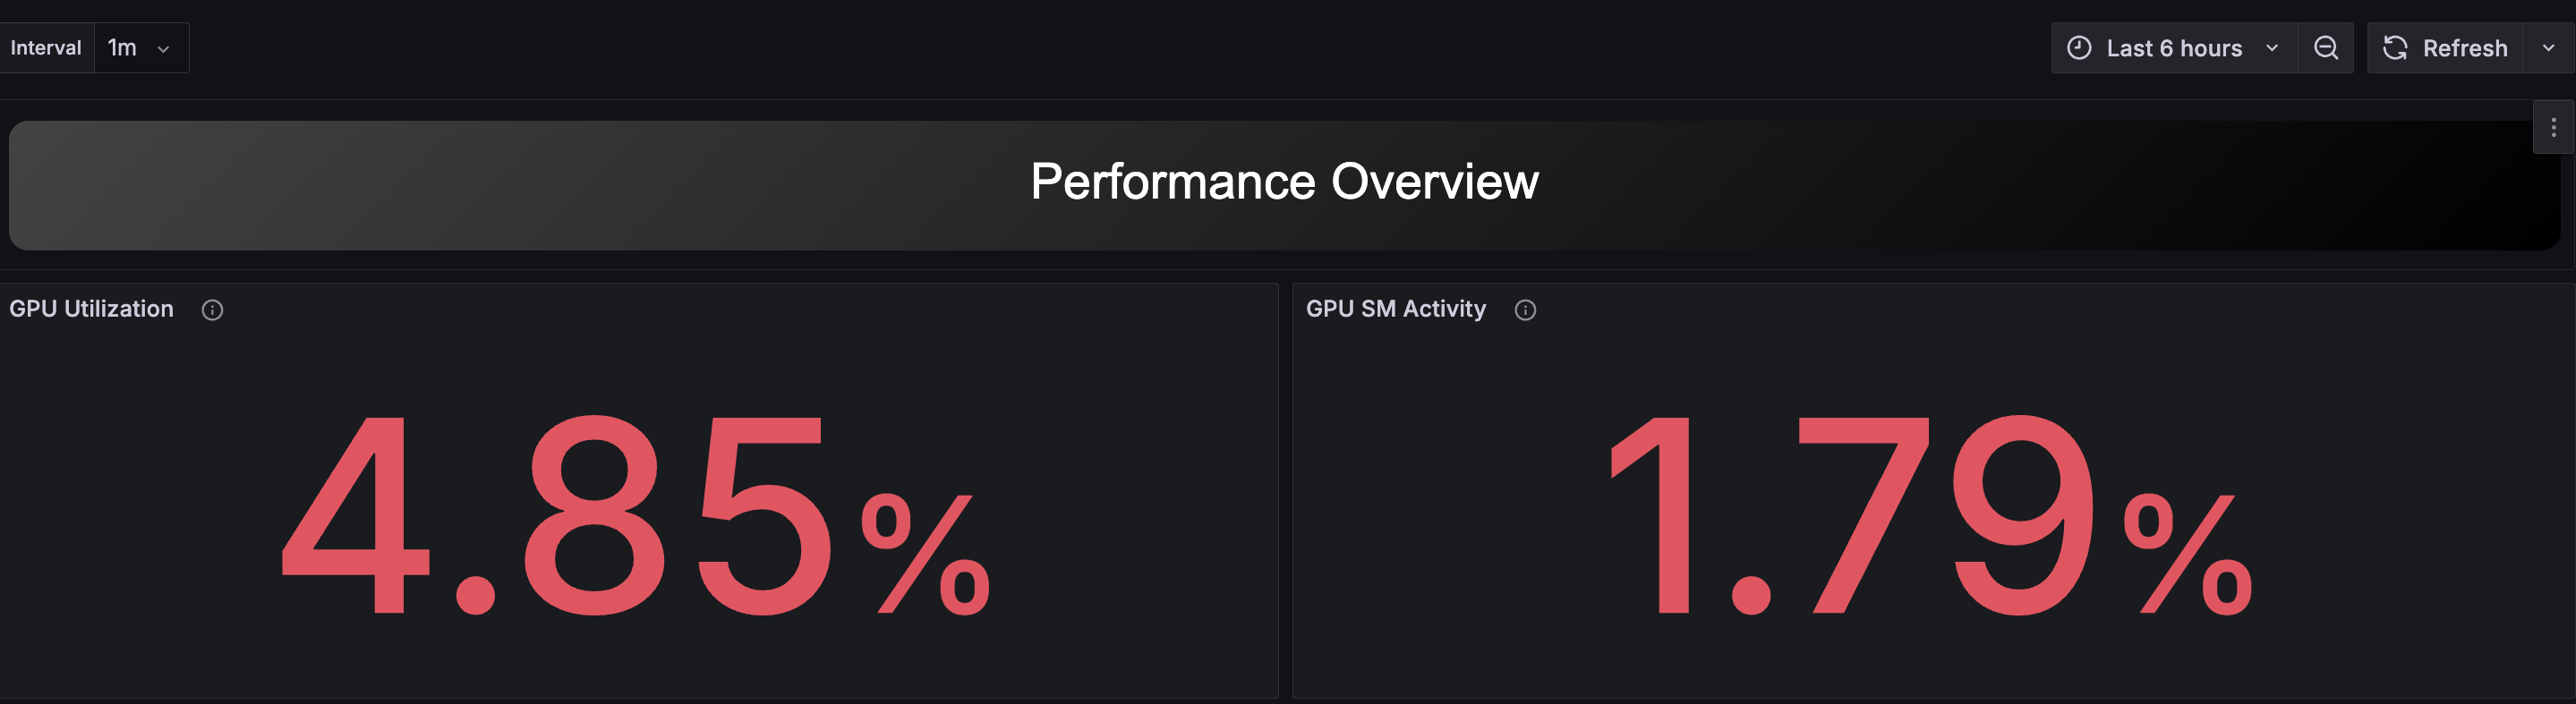
Performance Overview
This dashboard allows you to view performance-related information for all GPU hosts being observed.
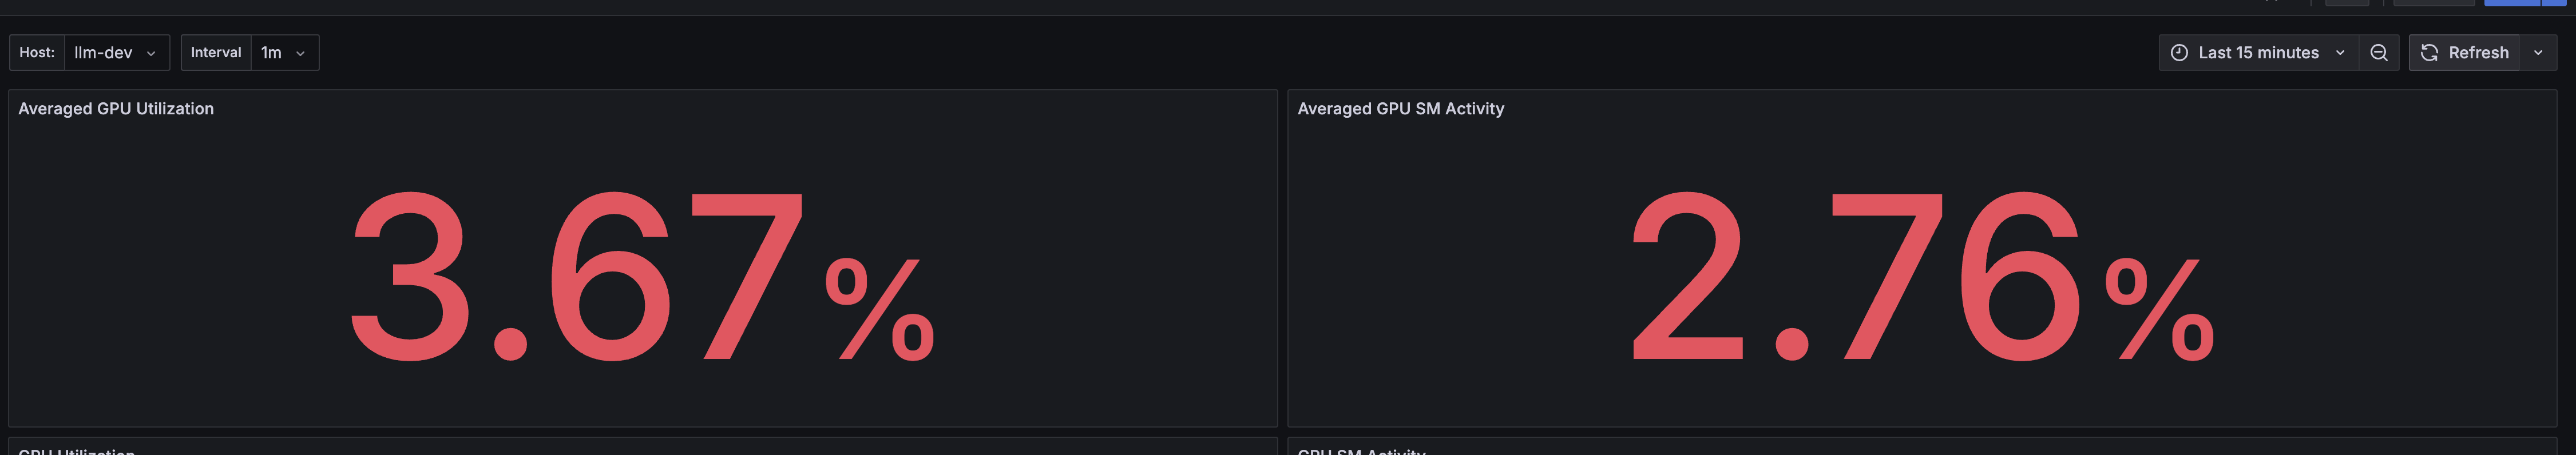
At the top of the page, statistical values of important GPU metrics for the target period are displayed. The closer these values are to 100%, the more frequently the GPU is being used.
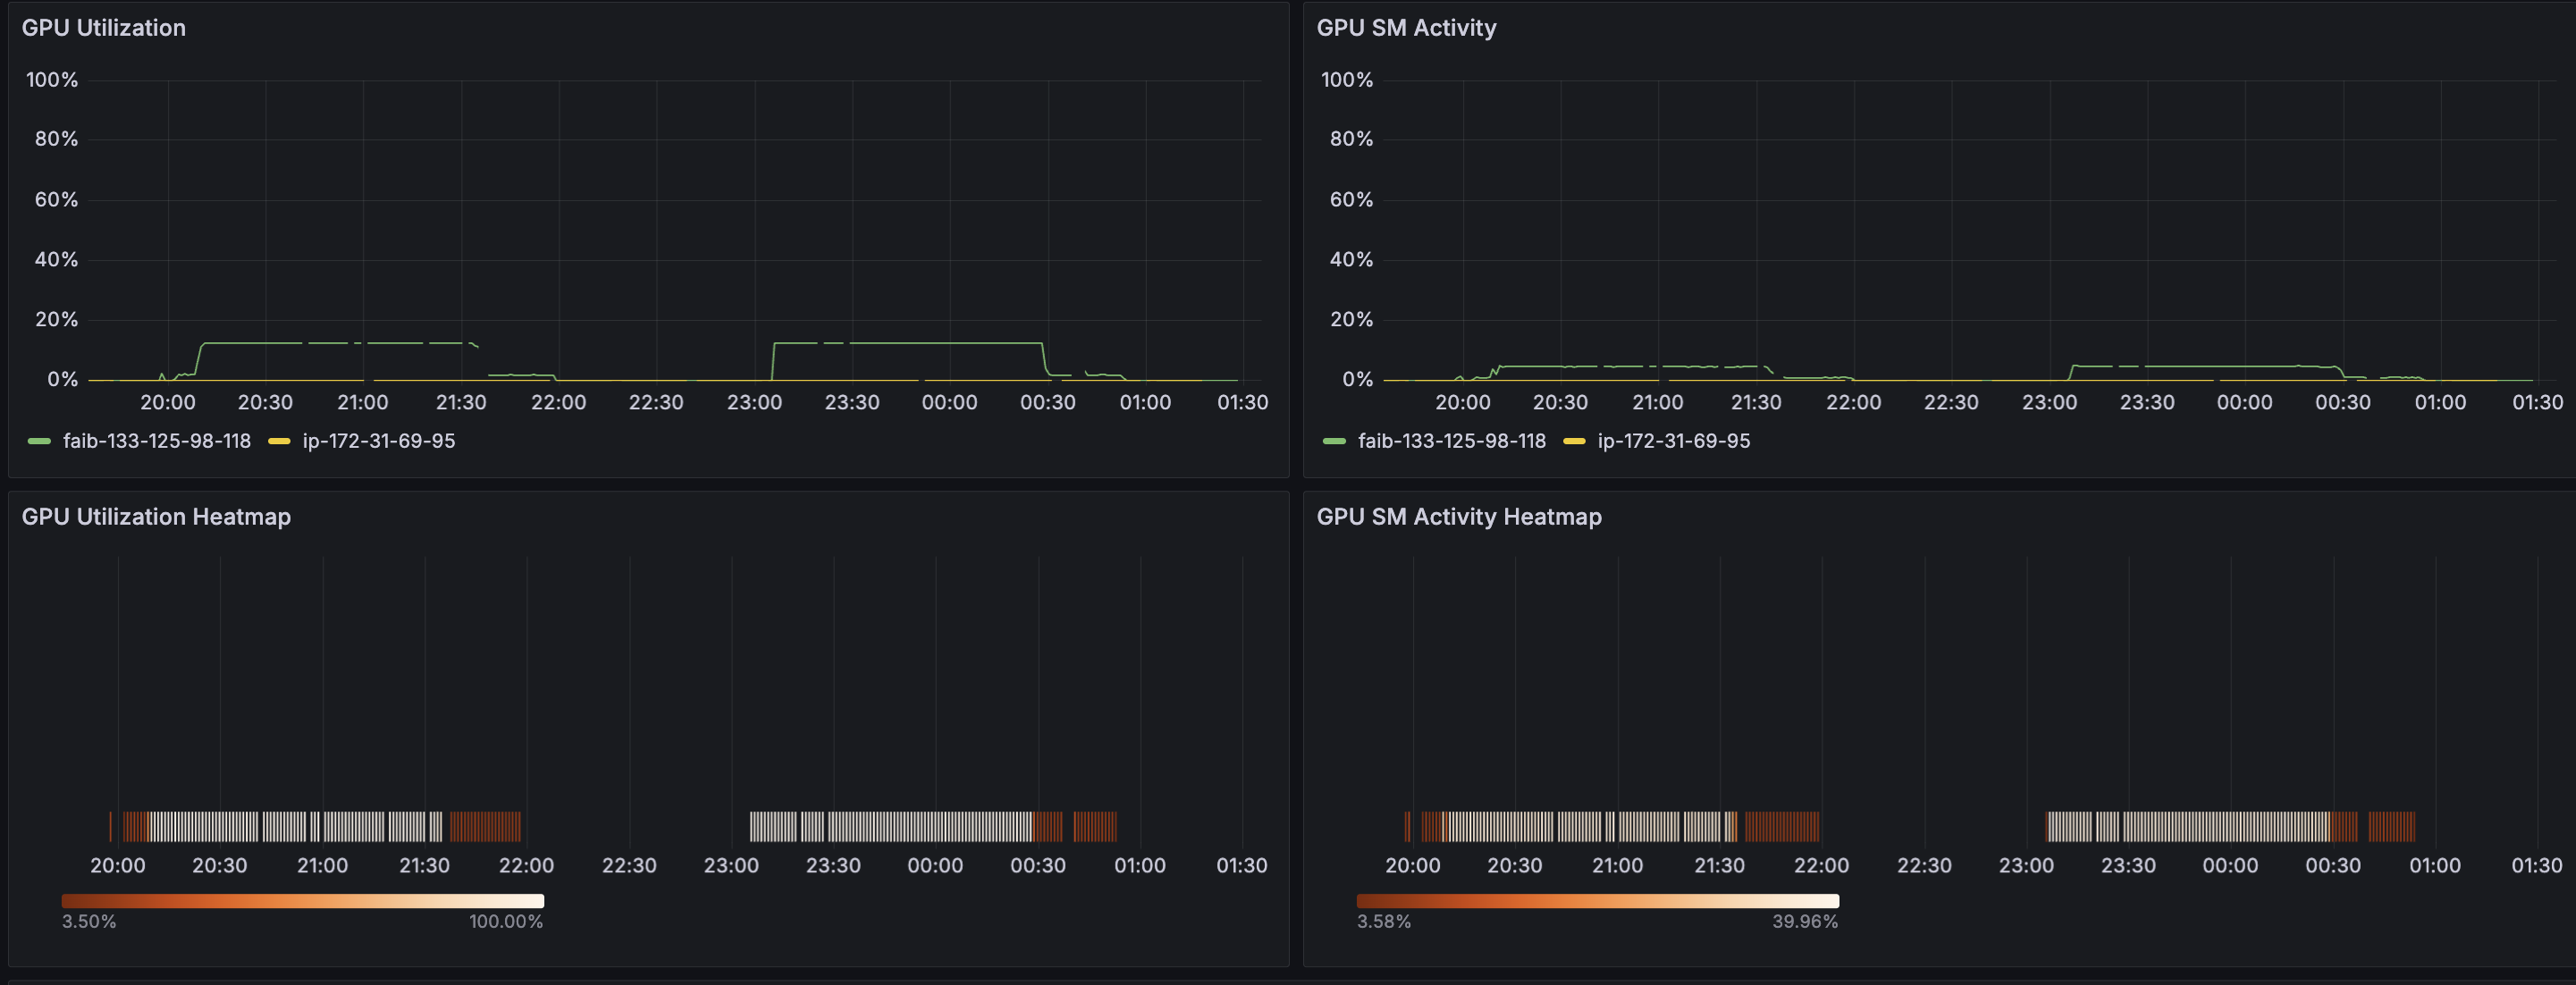
Below that, time-series transitions of these metrics per host and heatmaps per GPU are displayed together.
At the bottom of the dashboard, host and job information is displayed in table format. Each row is a hyperlink, and clicking these links navigates to the Performance Details dashboard for the corresponding host or job.
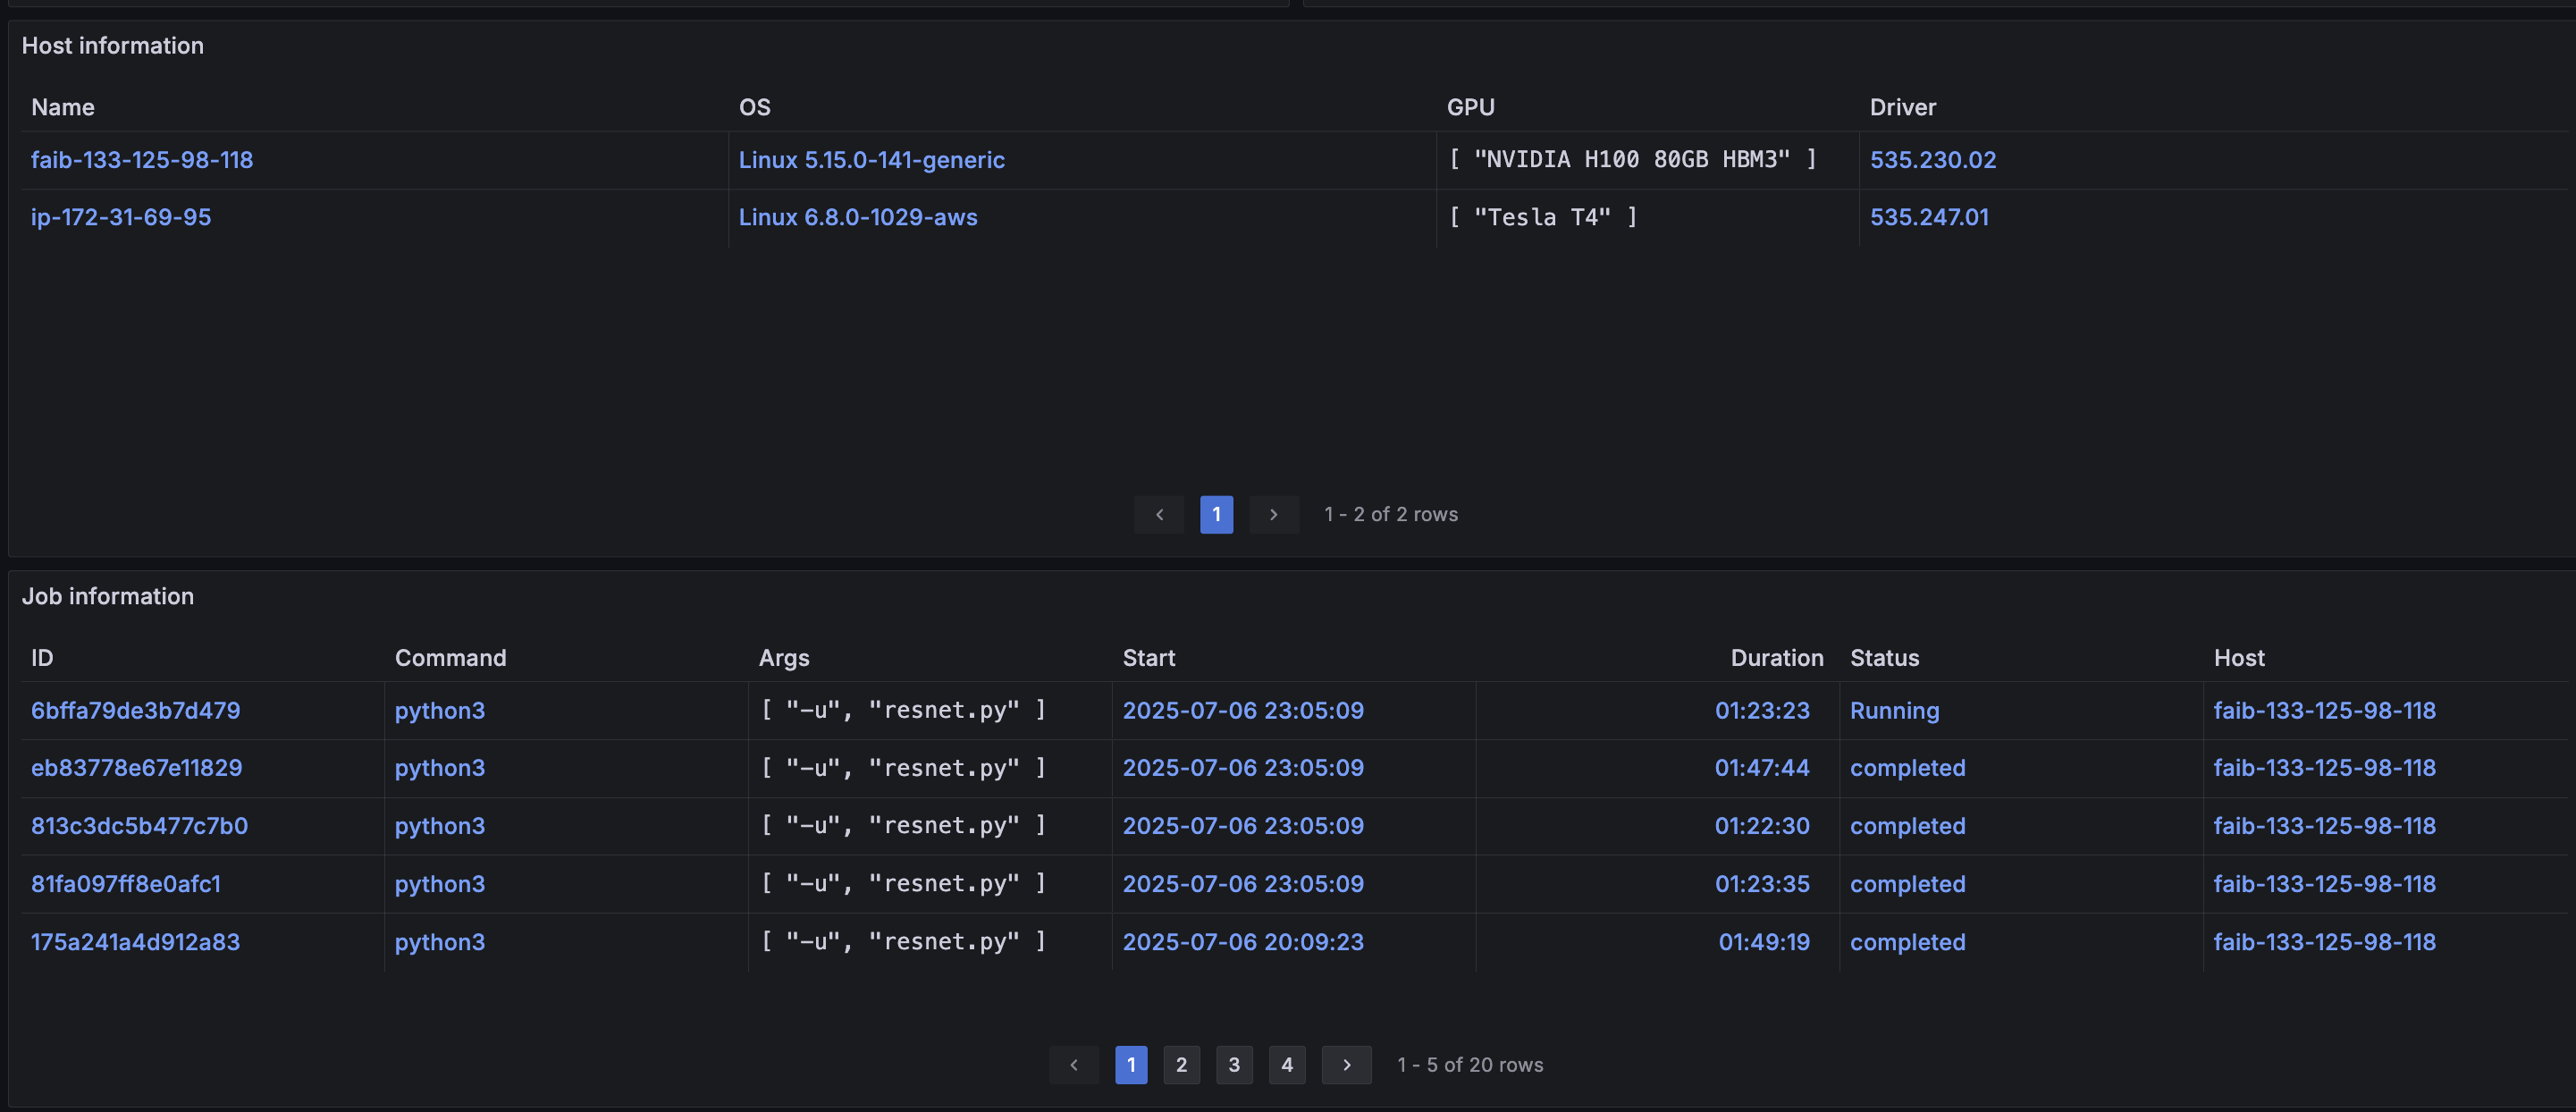
A host refers to each compute node that AIBooster is observing.
A job refers to processes whose process tree ID (meta-information about processes) meets specific conditions.
The process tree ID is created by listing all parent processes' /proc/<pid>/comm in chronological order, separated by /.
By default, process tree IDs matching the following regular expression are treated as jobs:
systemd.*/([a-z]*sh|containerd-shim-runc-v2)/.*python[0-9.]*$
Interpreting this expression means that all Python processes called from within containers or from shells are treated as jobs.
Performance Details / Host
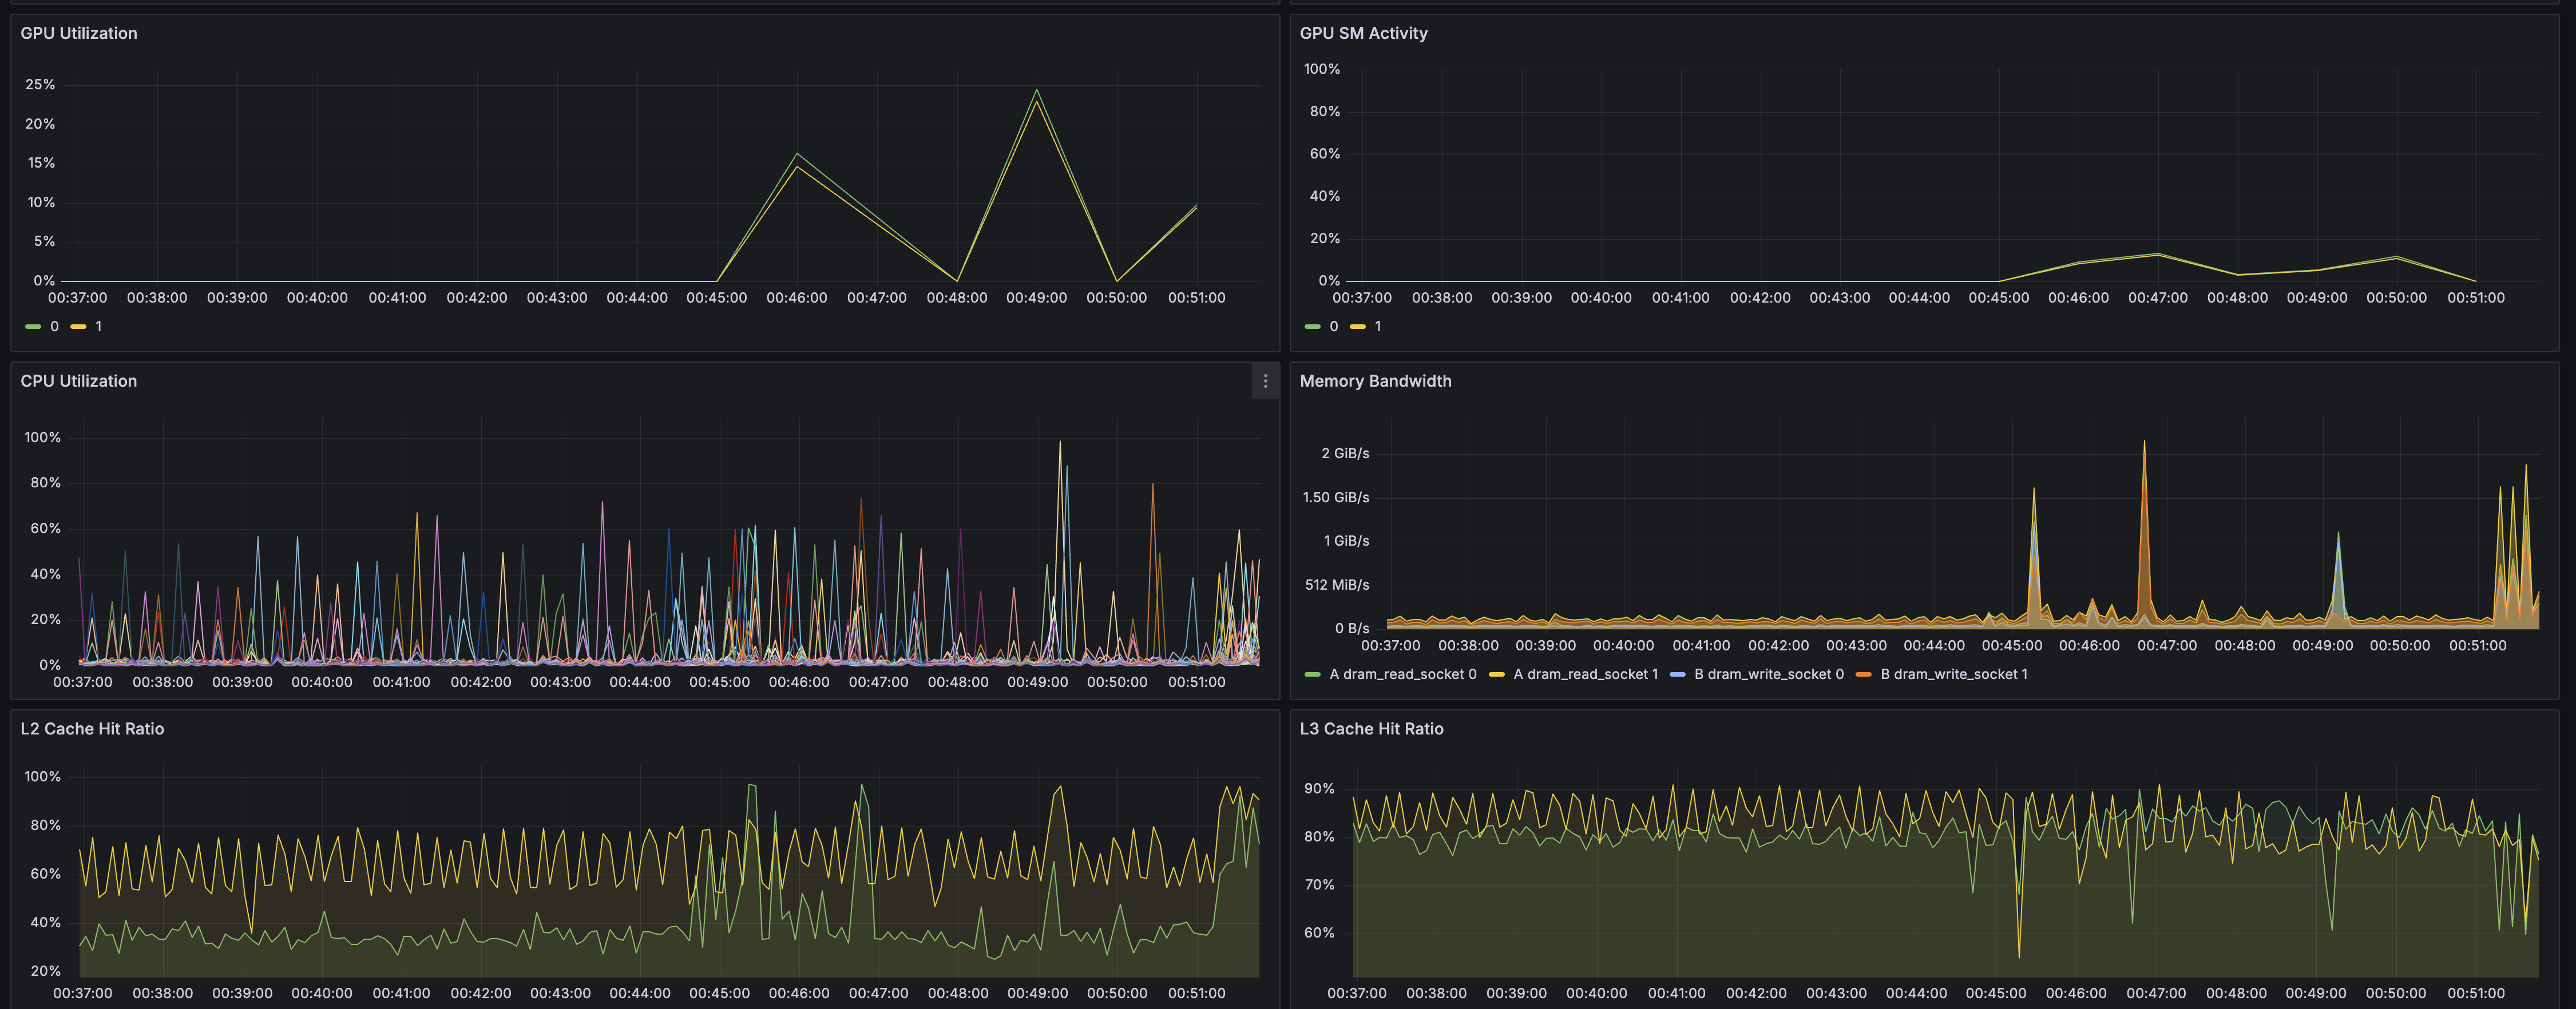
This dashboard can be displayed by selecting a specific Host from Performance Overview. Since you can view performance metrics per host, you can analyze resource usage and bottlenecks on specific nodes.
The following panels display these metrics as time-series graphs:
- GPU Utilization
- GPU SM Activity
- CPU Utilization
- Memory Bandwidth
- L2 Cache Hit Ratio
- L3 Cache Hit Ratio
- Network Bandwidth
- Storage Bandwidth
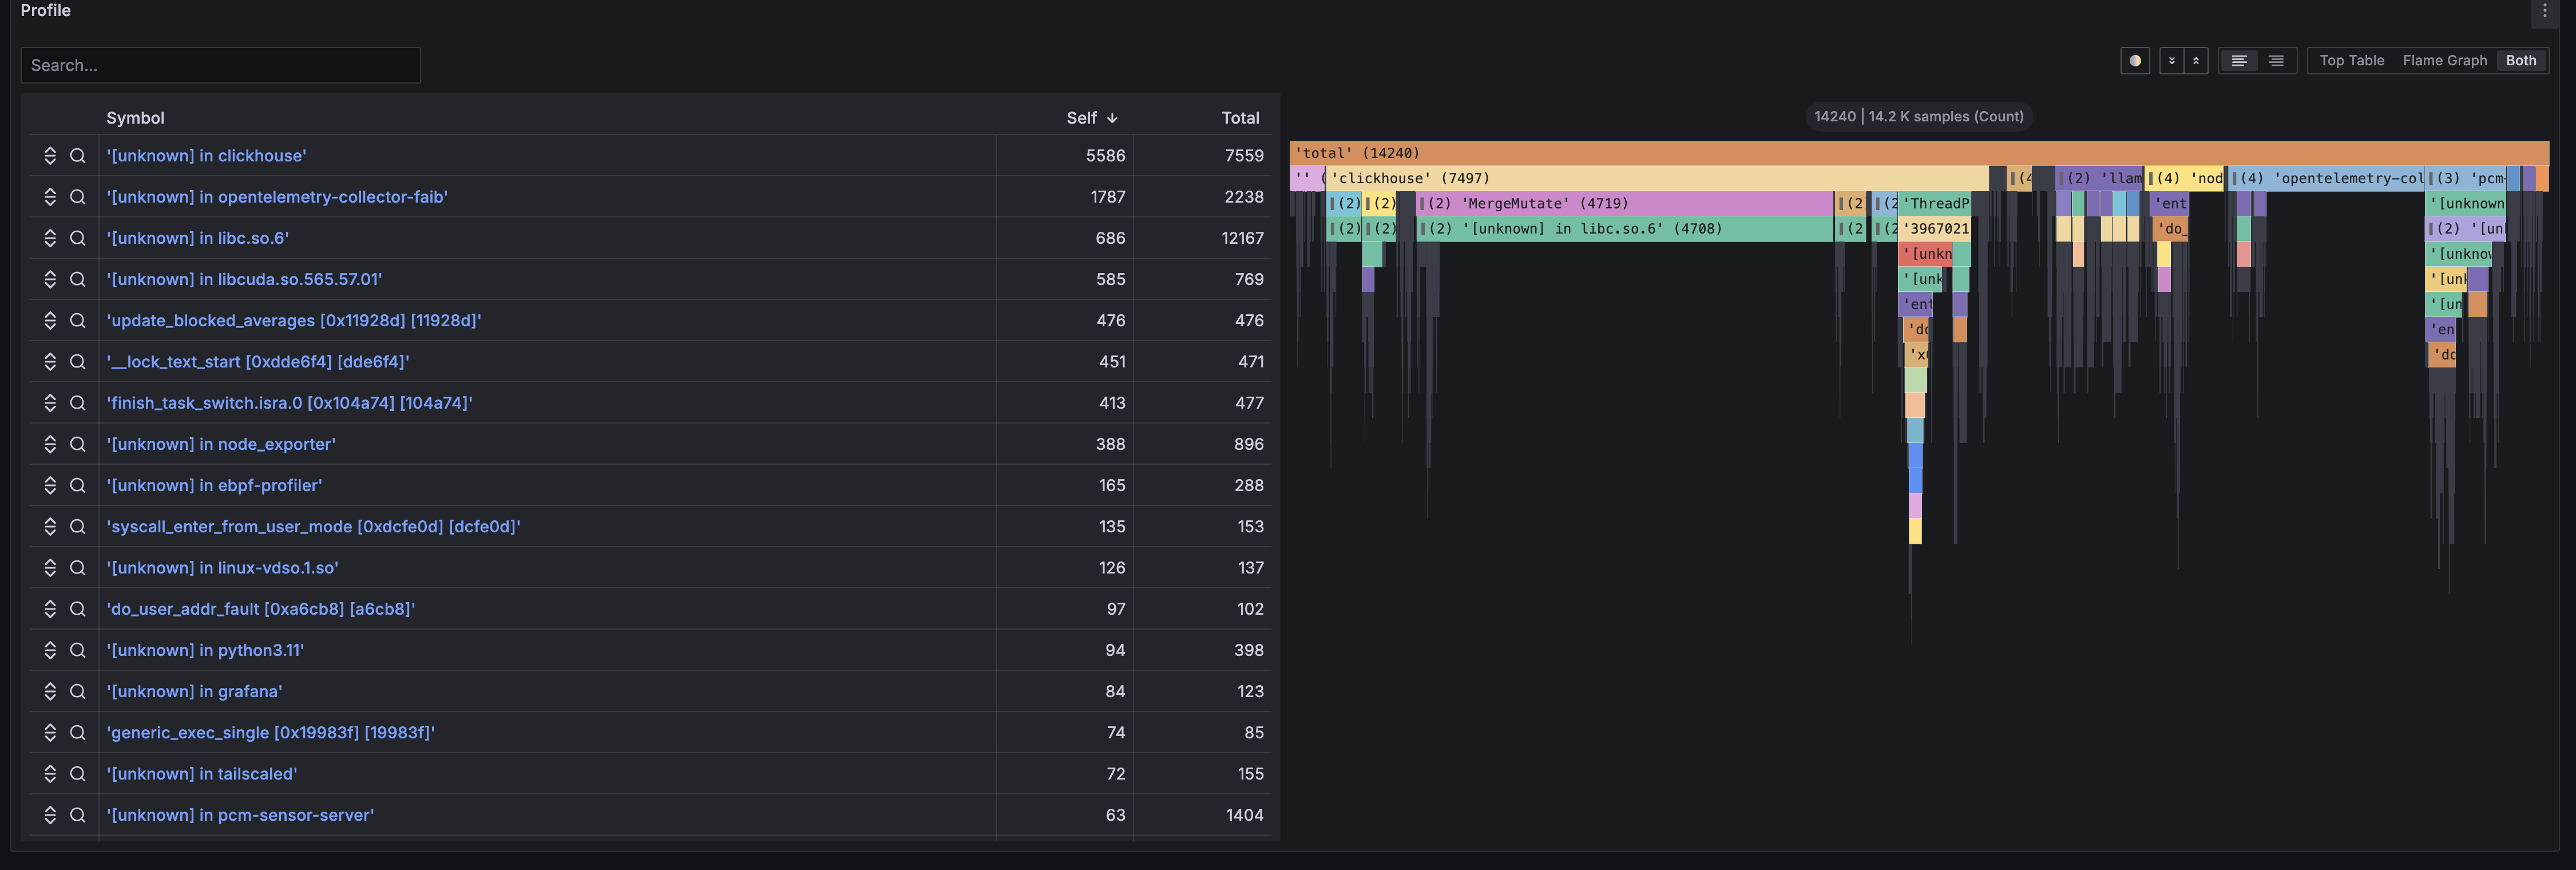
Additionally, in the Profile panel, you can view flame graphs of programs running on the node. Flame graphs are panels for analyzing program bottlenecks at the source code level by reconstructing sampled stack trace information. For details about flame graphs, please refer to the explanation page.
The following Prometheus exporters are supported, and their metric information can help identify system-wide performance bottlenecks and find optimization points:
By combining the metrics collected by these exporters, you can comprehensively monitor and analyze resource usage across the entire system, including CPU, GPU, memory, network, and storage. For details, please refer to the official documentation at the linked pages.
You can add panels using metrics provided by these exporters. For detailed procedures, please refer to Customize Visualization and Telemetry.
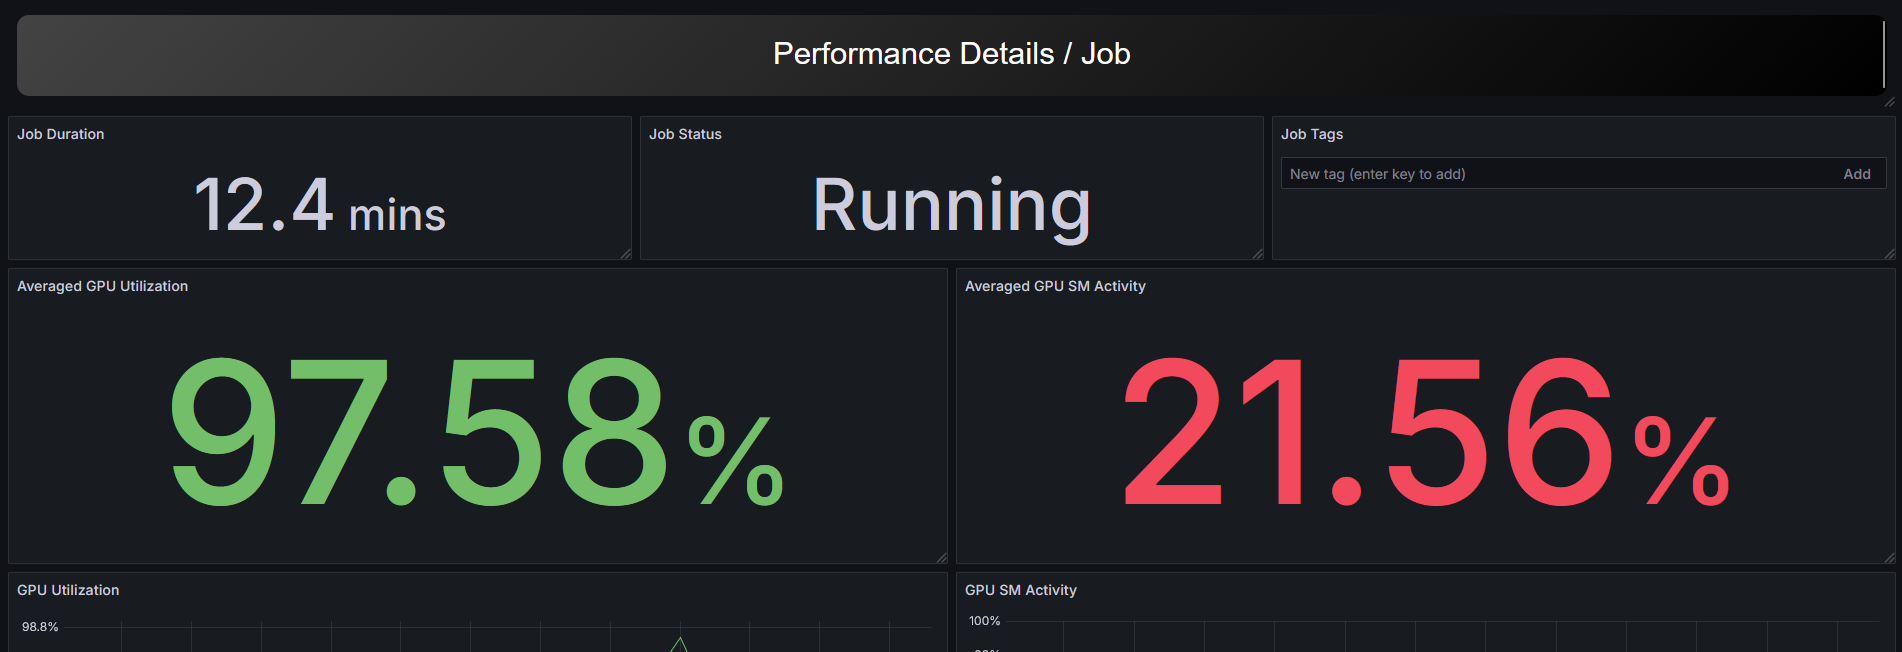
Performance Details / Job
This dashboard can be displayed by selecting a specific Job from Performance Overview. You can check performance information per job, and since various metrics are pre-focused on job execution time and host, you can analyze resource usage and performance bottlenecks for specific jobs.