What is AIBooster?
AIBooster is a performance engineering platform for continuously observing and improving the performance of AI workloads.
- PO: Performance Observability
- 🔍 Visualization: View usage rates and efficiency of various hardware at a glance
- 📊 Analysis: Identify software bottlenecks and discover improvement opportunities
- PI: Performance Intelligence
- ⚡ Performance Improvement: Continuously improve performance with automatic tuning
- 💰 Cost Reduction: Reduce inefficient resource usage and improve ROI
Through visualization dashboards, users can visualize the utilization efficiency of various hardware resources such as CPU, GPU, interconnect, and storage, as well as software bottlenecks, to analyze the performance characteristics of AI workloads. Furthermore, by applying optimization frameworks designed for AI workloads, efficient performance improvements are possible.
Start fast and cost-effective AI training and inference with AIBooster!
Feature Highlights
Improved Hyperparameter Tuning Experience with ZenithTune
In distributed training of large language models (LLMs), numerous parameters such as tensor parallelism, pipeline parallelism, micro-batch size, and activation recomputation have a significant impact on training throughput. However, finding the optimal combination of these parameters is highly dependent on model configuration and cluster environment, requiring specialized knowledge and extensive trial-and-error.
AIBooster ZenithTune is a framework that automatically optimizes hyperparameters for distributed training to improve training throughput. However, defining tuning configurations required writing Python scripts, which was a barrier to adoption. Additionally, optimization could require significant time in some cases.
In this release, we have made major updates to resolve these issues and significantly improve the hyperparameter tuning experience with ZenithTune.
No-Code Tuning
Previously, ZenithTune required writing Python scripts of several dozen lines that included search space definitions, command construction, output parsing, and pruning conditions. In this release, we have added no-code tuning, which enables hyperparameter tuning entirely from the command line without writing any Python scripts.
Simply specify a preset designed for your framework, and parameter exploration, command execution, and performance evaluation are performed automatically. This release provides the megatron preset for Megatron-LM and ms-swift, which automatically explores parallelization configurations including tensor parallelism (TP), pipeline parallelism (PP), context parallelism (CP), and expert parallelism (EP), as well as micro-batch size and activation recomputation settings, to maximize training throughput (TFLOP/s/GPU).
zenithtune optimize --preset megatron \
    --args n_gpus=8,gbs=64 \
    --n-trials 50 --timeout-dynamic \
    -- python pretrain_gpt.py --num-layers 30 --hidden-size 4096 --train-iters 3 ...
For details on no-code tuning, refer to No-Code Tuning.
New Search Algorithms for Megatron
Previously, ZenithTune only provided generic Optuna-based BlackBox optimization. This release introduces two new search algorithms that leverage domain knowledge of Megatron's parallelization strategies:
- Heuristic search (default): Deterministic search based on domain knowledge
- Staged BlackBox search: Staged Bayesian optimization
The following chart compares the results of hyperparameter tuning with each search strategy for Qwen3-Omni-30B supervised fine-tuning (SFT) on NVIDIA A100 x16 GPUs:
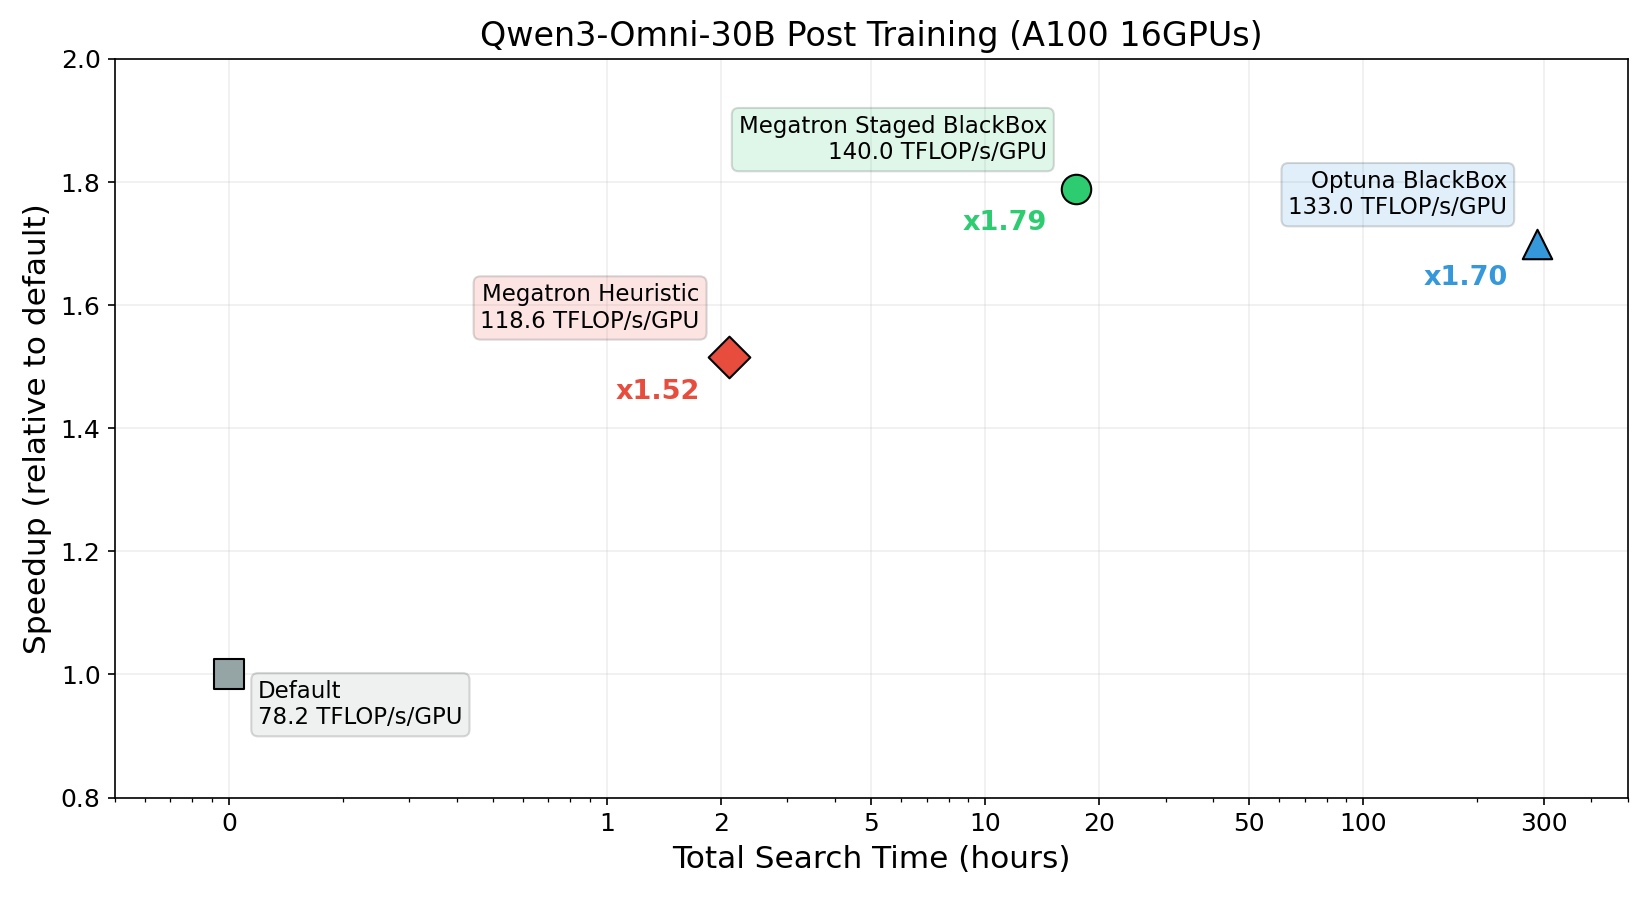
Heuristic search improved training throughput from 78.2 to 118.6 TFLOP/s/GPU in just approximately 2 hours of search, achieving approximately 1.52x faster training per epoch.
Staged BlackBox search pushed throughput to 140.0 TFLOP/s/GPU in approximately 18 hours of search, achieving approximately 1.79x faster training. Furthermore, this yielded better hyperparameters in approximately 1/16 of the search time compared to the previously provided BlackBox optimization.
By selecting the appropriate search algorithm for your use case, you can balance the trade-off between search time and training speedup. For guidance on choosing a search strategy, including cost-effectiveness considerations, refer to Cost-Effectiveness of Hyperparameter Tuning.
✨ Guides
Quick Start Guide
Learn about AIBooster overview, setup methods, and basic usage.
Performance Observation Guide
Learn how to use visualization dashboards to observe AI workload performance.
Performance Improvement Guide
Learn how to use frameworks to improve AI workload performance.