What is AIBooster?
AIBooster is a performance engineering platform for continuously observing and improving the performance of AI workloads.
- PO: Performance Observability
- 🔍 Visualization: View usage rates and efficiency of various hardware at a glance
- 📊 Analysis: Identify software bottlenecks and discover improvement opportunities
- PI: Performance Intelligence
- ⚡ Performance Improvement: Continuously improve performance with automatic tuning
- 💰 Cost Reduction: Reduce inefficient resource usage and improve ROI
Through visualization dashboards, users can visualize the utilization efficiency of various hardware resources such as CPU, GPU, interconnect, and storage, as well as software bottlenecks, to analyze the performance characteristics of AI workloads. Furthermore, by applying optimization frameworks designed for AI workloads, efficient performance improvements are possible.
Start fast and cost-effective AI training and inference with AIBooster!
Feature Highlights
Cluster Overview Dashboard
AIBooster's performance observability feature monitors AI workloads running on clusters to provide users with a range of insights, including:
- Understanding macro performance trends across the entire cluster and over medium- to long-term periods
- Monitoring hardware utilization efficiency by node or device
- Analyzing differences in performance characteristics between workloads
When operating large-scale clusters, gaining a bird's-eye view of cluster health and identifying issues or improvement opportunities in a timely manner is critical. However, reviewing individual nodes and jobs one by one is time-consuming, making it difficult to understand the overall cluster status at a glance.
In this release, we have added the Cluster Overview dashboard, which lets you grasp the cluster-wide GPU activity at a glance. By checking this dashboard regularly, you can detect anomalies or inefficient jobs in the cluster at an early stage.
Cluster-Wide Job Activity
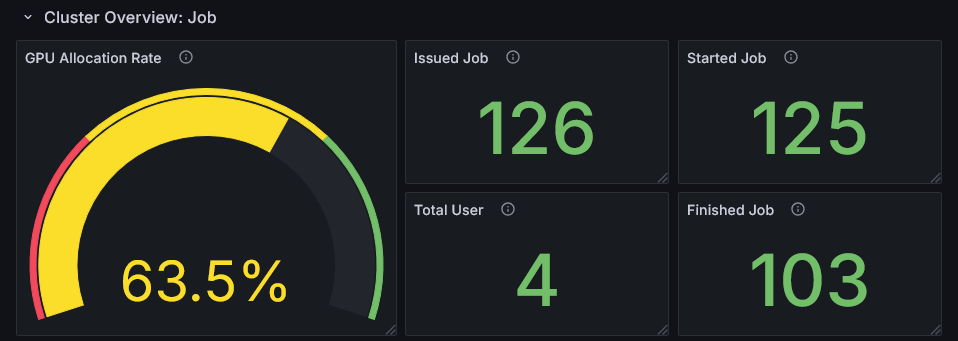
The GPU Allocation Rate (the proportion of time during the observation period that jobs had GPUs allocated) and statistics on Issued/Started/Finished Jobs let you assess whether cluster resources are being utilized efficiently.
- Low GPU Allocation Rate: Indicates available capacity in the cluster. Consider onboarding new workloads or encouraging users to make more active use of GPUs.
- High GPU Allocation Rate: Indicates resource pressure. This is a signal to prioritize performance improvements for individual jobs.
Cluster-Wide Hardware Metrics
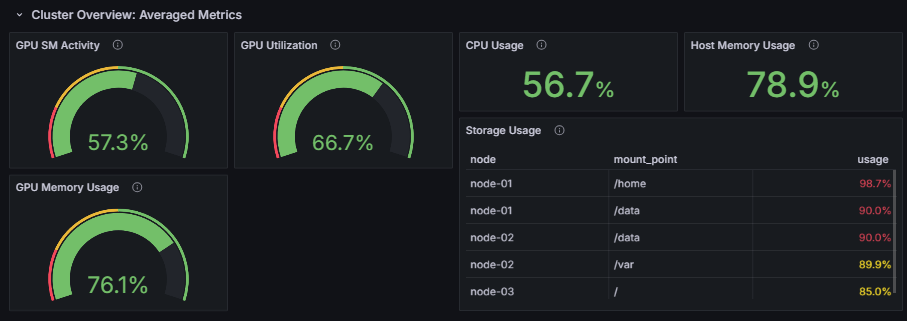
Monitor the average GPU utilization across all GPUs in the cluster (SM Activity, GPU Utilization, and memory usage) as well as CPU and host memory usage over time. This gives you a macro-level view of whether GPU processing is running efficiently across the cluster.
In particular, focusing on GPU SM Activity (the proportion of time GPU Streaming Multiprocessors were actually performing computation) lets you quantitatively evaluate how efficiently GPU workloads are being executed.
Per-Node GPU Utilization Heatmap
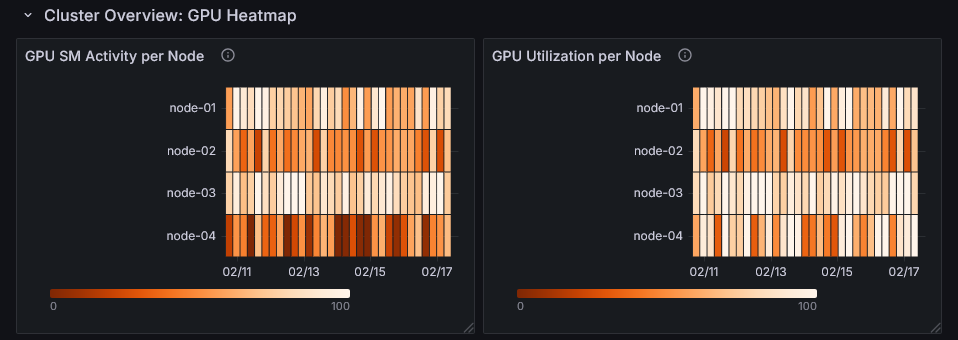
GPU utilization is visualized per node and time period as a heatmap, making it easy to intuitively spot nodes or time windows where utilization stands out. This helps you quickly identify nodes to investigate or time periods with room for performance improvement.
For details, refer to Analyzing your Cluster.
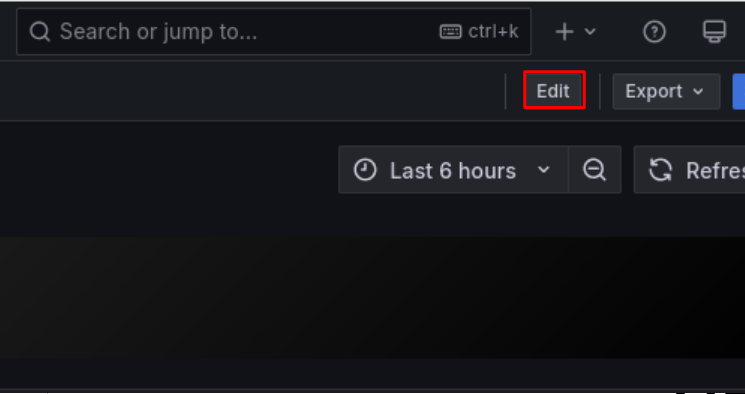
Dashboard Customization and Panel Library
AIBooster's performance observability feature is built on top of OSS such as OpenTelemetry and Grafana, and can be flexibly customized from telemetry data collection to dashboard visualization. In this release, we have documented the customization options as official documentation.
Panel Library
The standard dashboards display only representative metrics. Using the Panel Library, you can add detailed metric panels with just a few clicks.
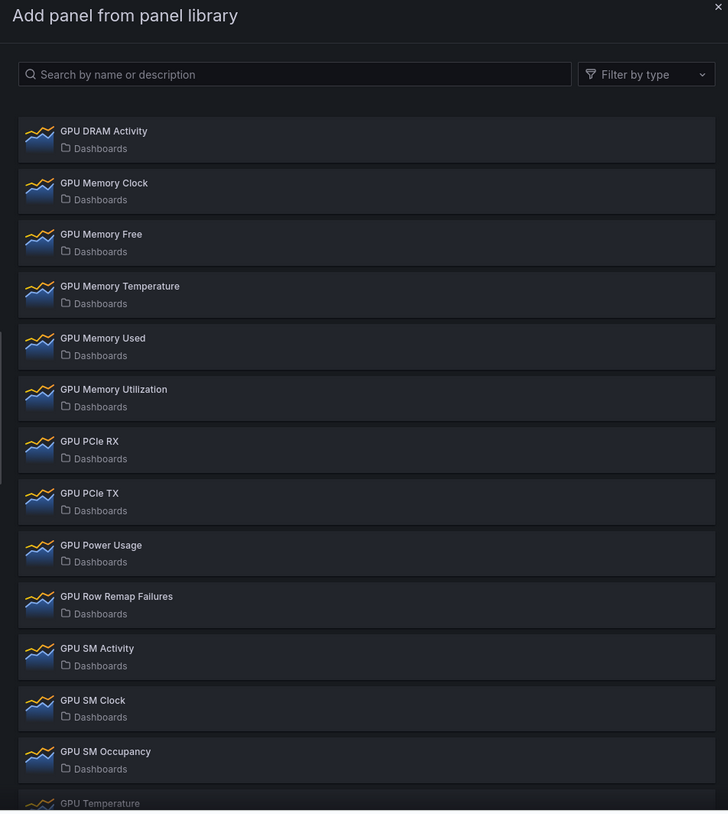
The following types of panels are available:
- GPU-related metrics (DCGM): GPU utilization, temperature, power consumption, memory usage, profiling information, etc.
- System metrics (Node Exporter): CPU load, memory, filesystem, network, etc.
Adding Custom Telemetry Data
Telemetry data not collected by AIBooster by default can also be added via OpenTelemetry or Prometheus-compatible exporters. By collecting metrics from your own applications and displaying them on dashboards, you can perform deeper analysis in combination with the standard hardware metrics and the like.
For details, refer to Customize Visualization and Telemetry.
NVIDIA DCGM v4 Support
AIBooster now supports NVIDIA DCGM v4, enabling collection and visualization of detailed GPU metrics such as GPU utilization and SM Activity even on the latest generation of NVIDIA GPUs.
✨ Guides
Quick Start Guide
Learn about AIBooster overview, setup methods, and basic usage.
Performance Observation Guide
Learn how to use visualization dashboards to observe AI workload performance.
Performance Improvement Guide
Learn how to use frameworks to improve AI workload performance.